Human factors professionals are often tasked with calculating human error rates, but how useful is reporting this number really?
In any system, there are a number of things that can go wrong and have an impact on either safety, efficiency or both.
Humans, of course, play an important part in the system, either by operating or maintaining parts of it, or by being users of a product or service. When humans interact with a system, there is always a degree of probability that mistakes will be made, and errors occur.
Human factors professionals are often asked to calculate these human error rates to support safety analyses, but how useful is this number?
The example we will use throughout this paper to illustrate our points is adapted from one of our current projects. It describes a new system introduced into a control centre to support a safety critical task performed by operators.
The operators are required to use the computer-based system to monitor the network, monitor and action alerts, and escalate and resolve issues.
Quantifying the Probability of Human Error
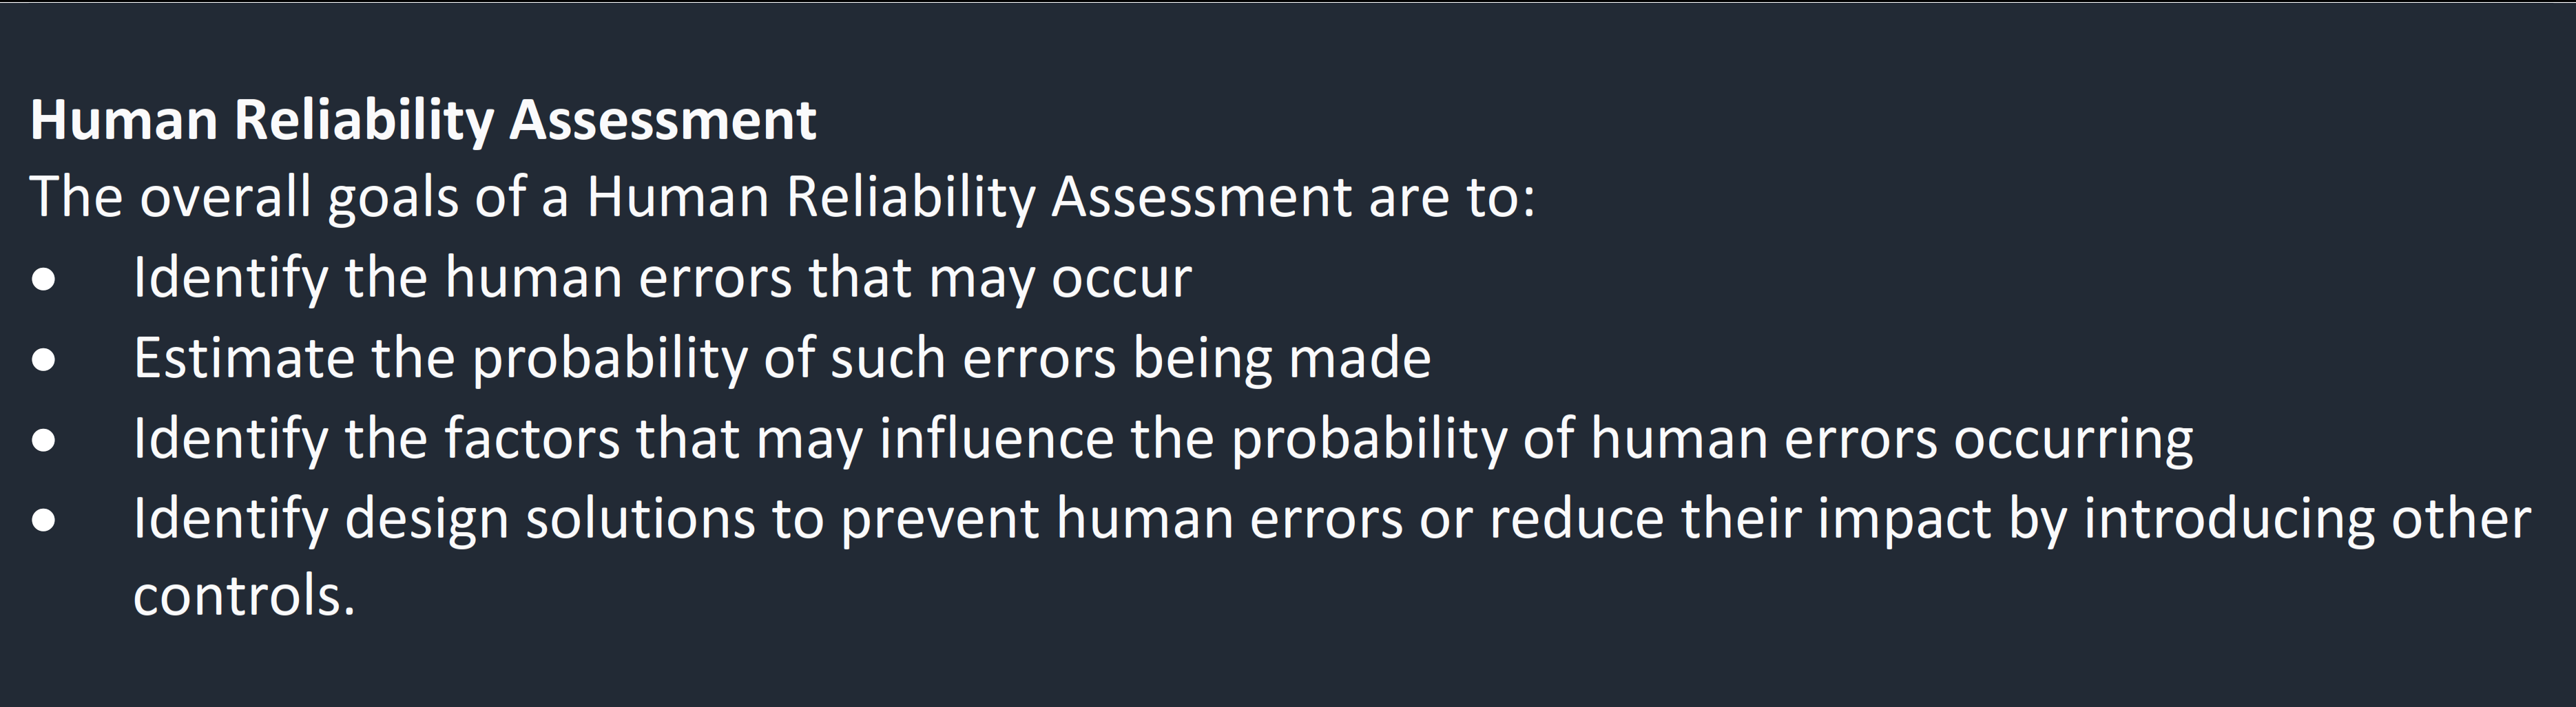
To better understand the probability of a human error occurring during a particular task, there are many Human Reliability Assessment (HRA) techniques human factors professionals can use.
Some of the more commonly used methods include Cognitive Reliability and Error Analysis Method (CREAM) and Human Error Assessment and Reduction Technique (HEART) to name just a few. By performing a HRA using one of these techniques, human factors professionals can quantify the likelihood of a human error occurring for a particular task. Each potential human error ends up with an associated ‘number’.
So what could we, or should we do with that number?
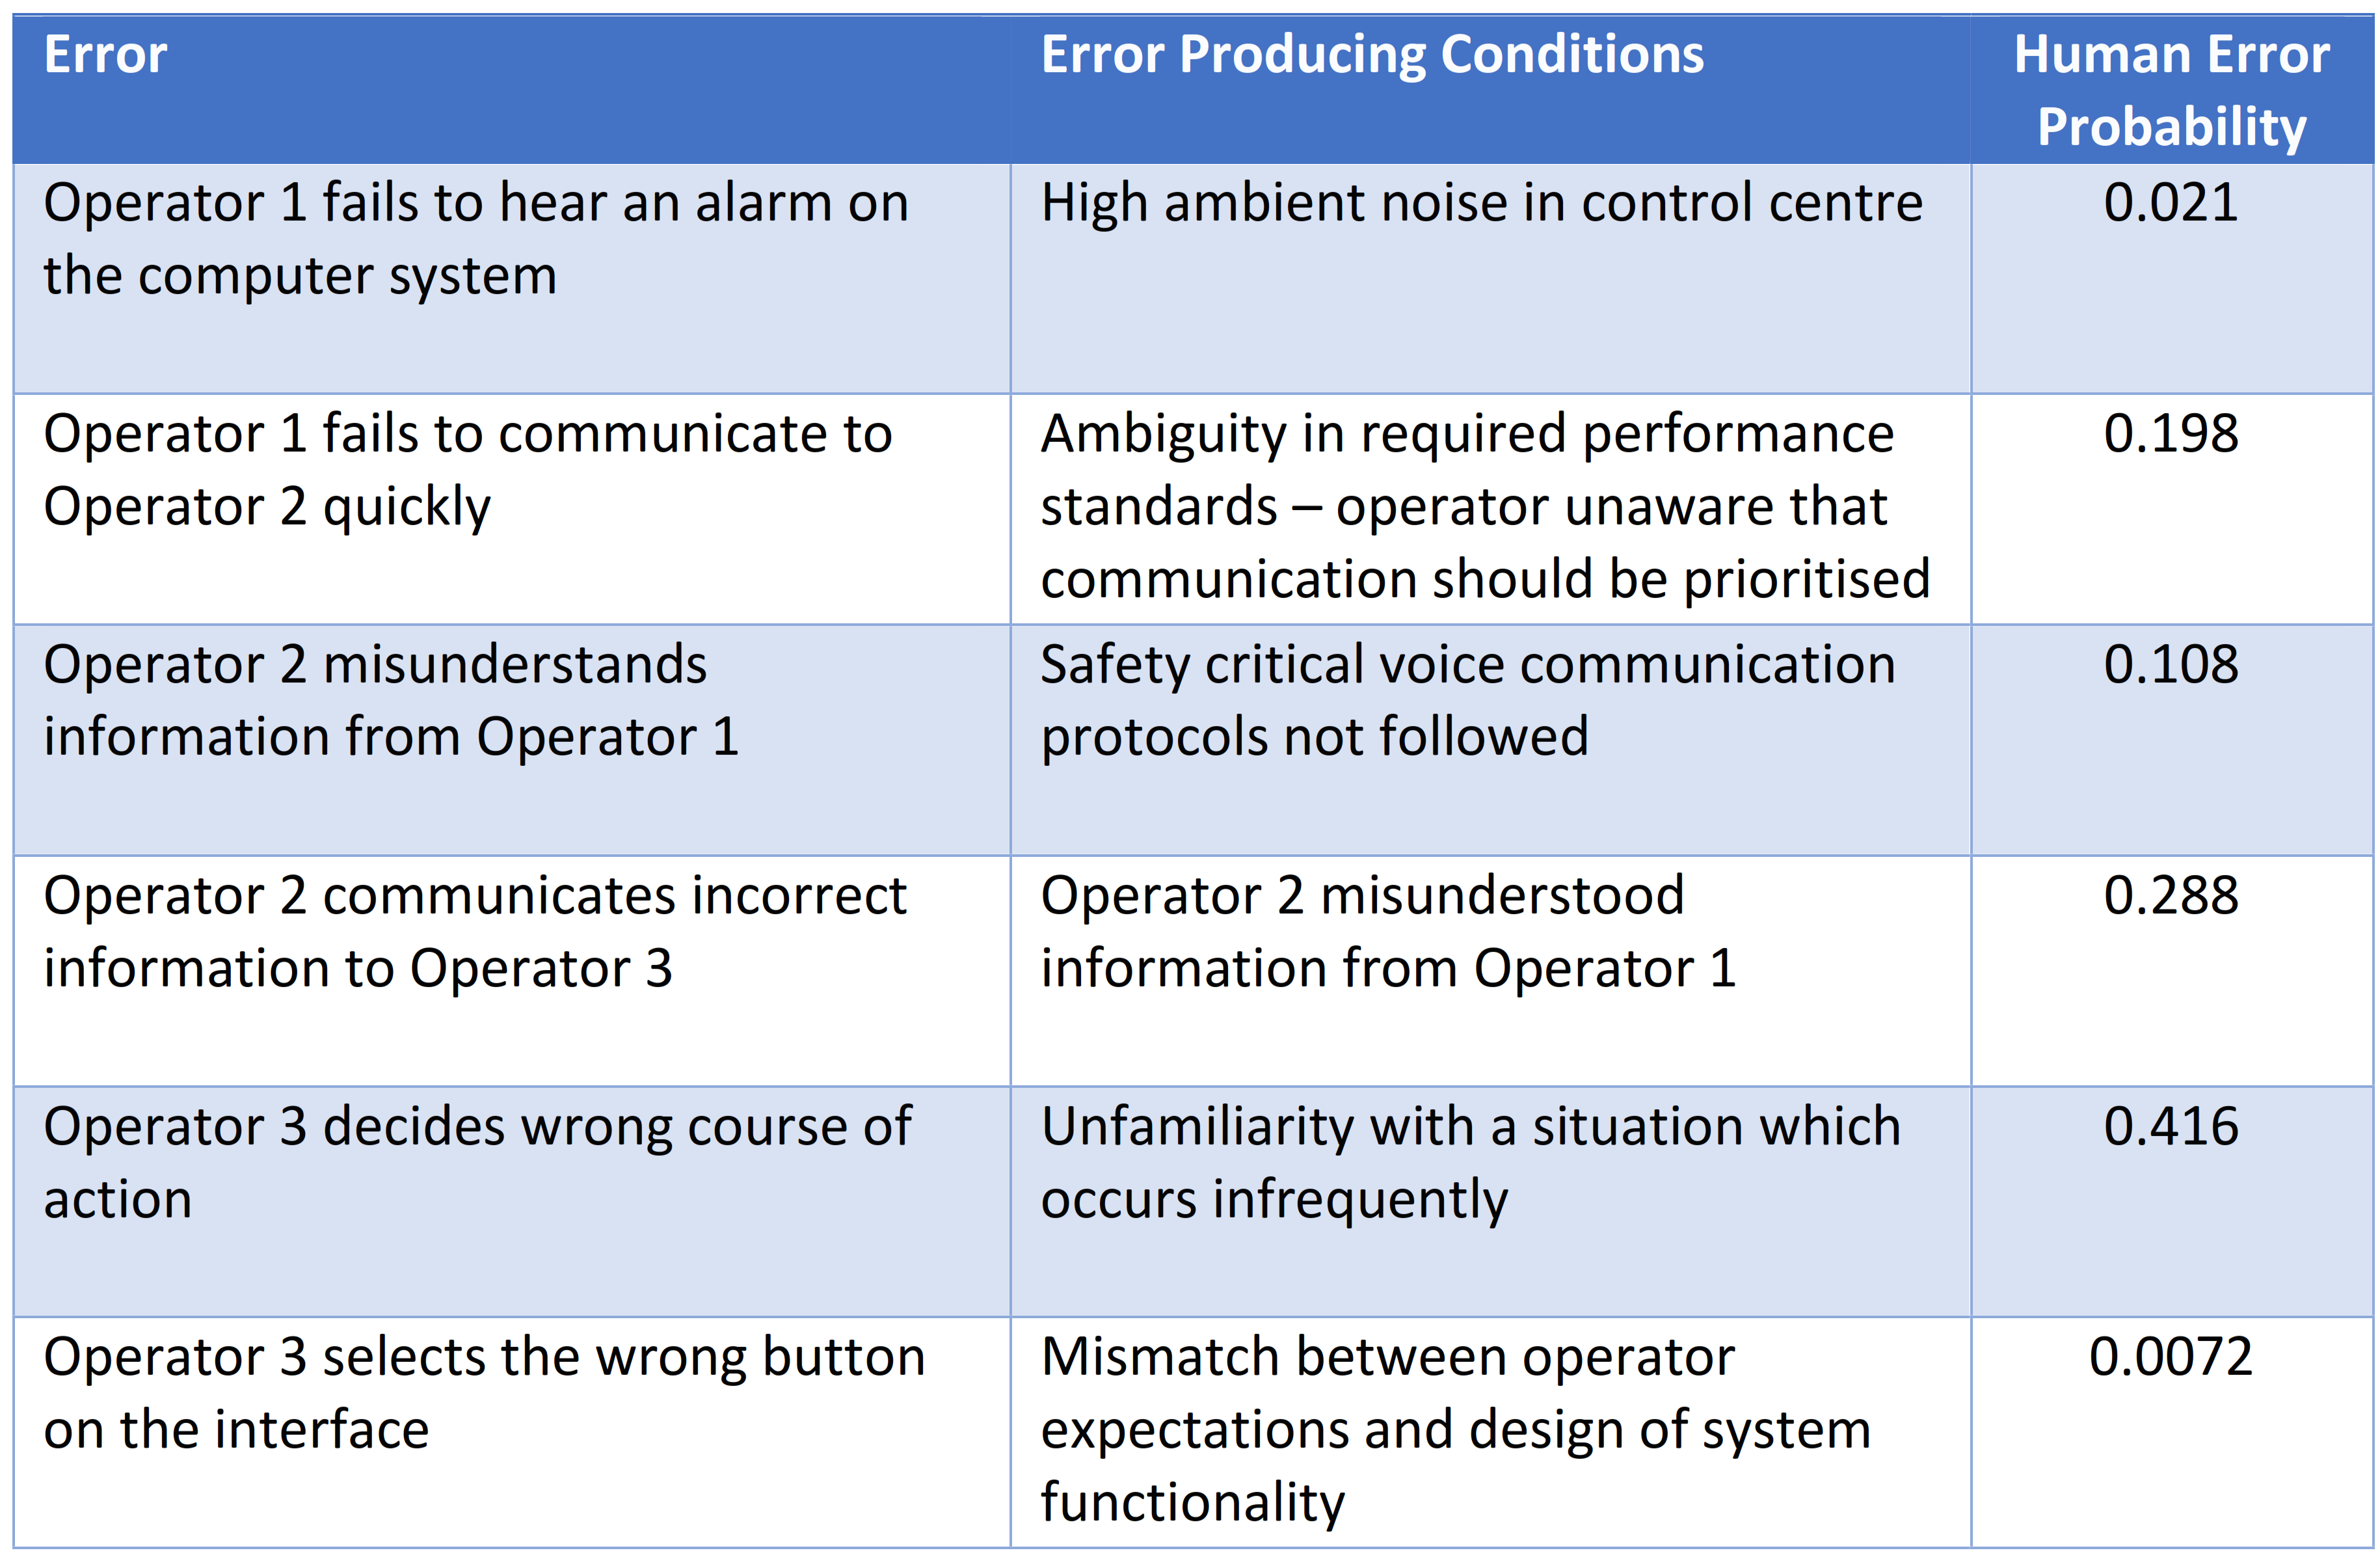
Coming back to our example, the project required a Fault Tree Analysis (FTA) to support the safety case for the use of the new system. This FTA required an estimation of human error rates.
To this end, a task analysis was developed and used to identify the potential errors that could be made and was the basis for the human error analysis in which the HEART technique was applied. For each potential human error, the probability of it occurring was then calculated.
The Value of Quantifying Human Error Probability is not in its Value
On its own, the number produced by the human error analysis for a particular potential error doesn’t mean much.
For a start, the magnitude of the number is very sensitive to both the inputs used and the practitioner conducting the assessment. This isn’t too much of a problem as long as the HRA approach has been applied consistently for each identified potential error.
Putting that aside, reporting only a number does not tell us how safe or efficient a system will be. Human error analysis is often predictive and relates to a system which isn’t yet in use. The estimated effect is therefore an informed estimate – the actual number may differ in practice.
It’s also important to recognise that the human error analysis process often focuses on equipment, and not necessarily the wider system in which people are involved. The result is that other potential systemic failures such as lack of staff competency or appropriate resource allocation, could go unnoticed.
So, if the exact number isn’t important, what is the point in calculating human error probability?
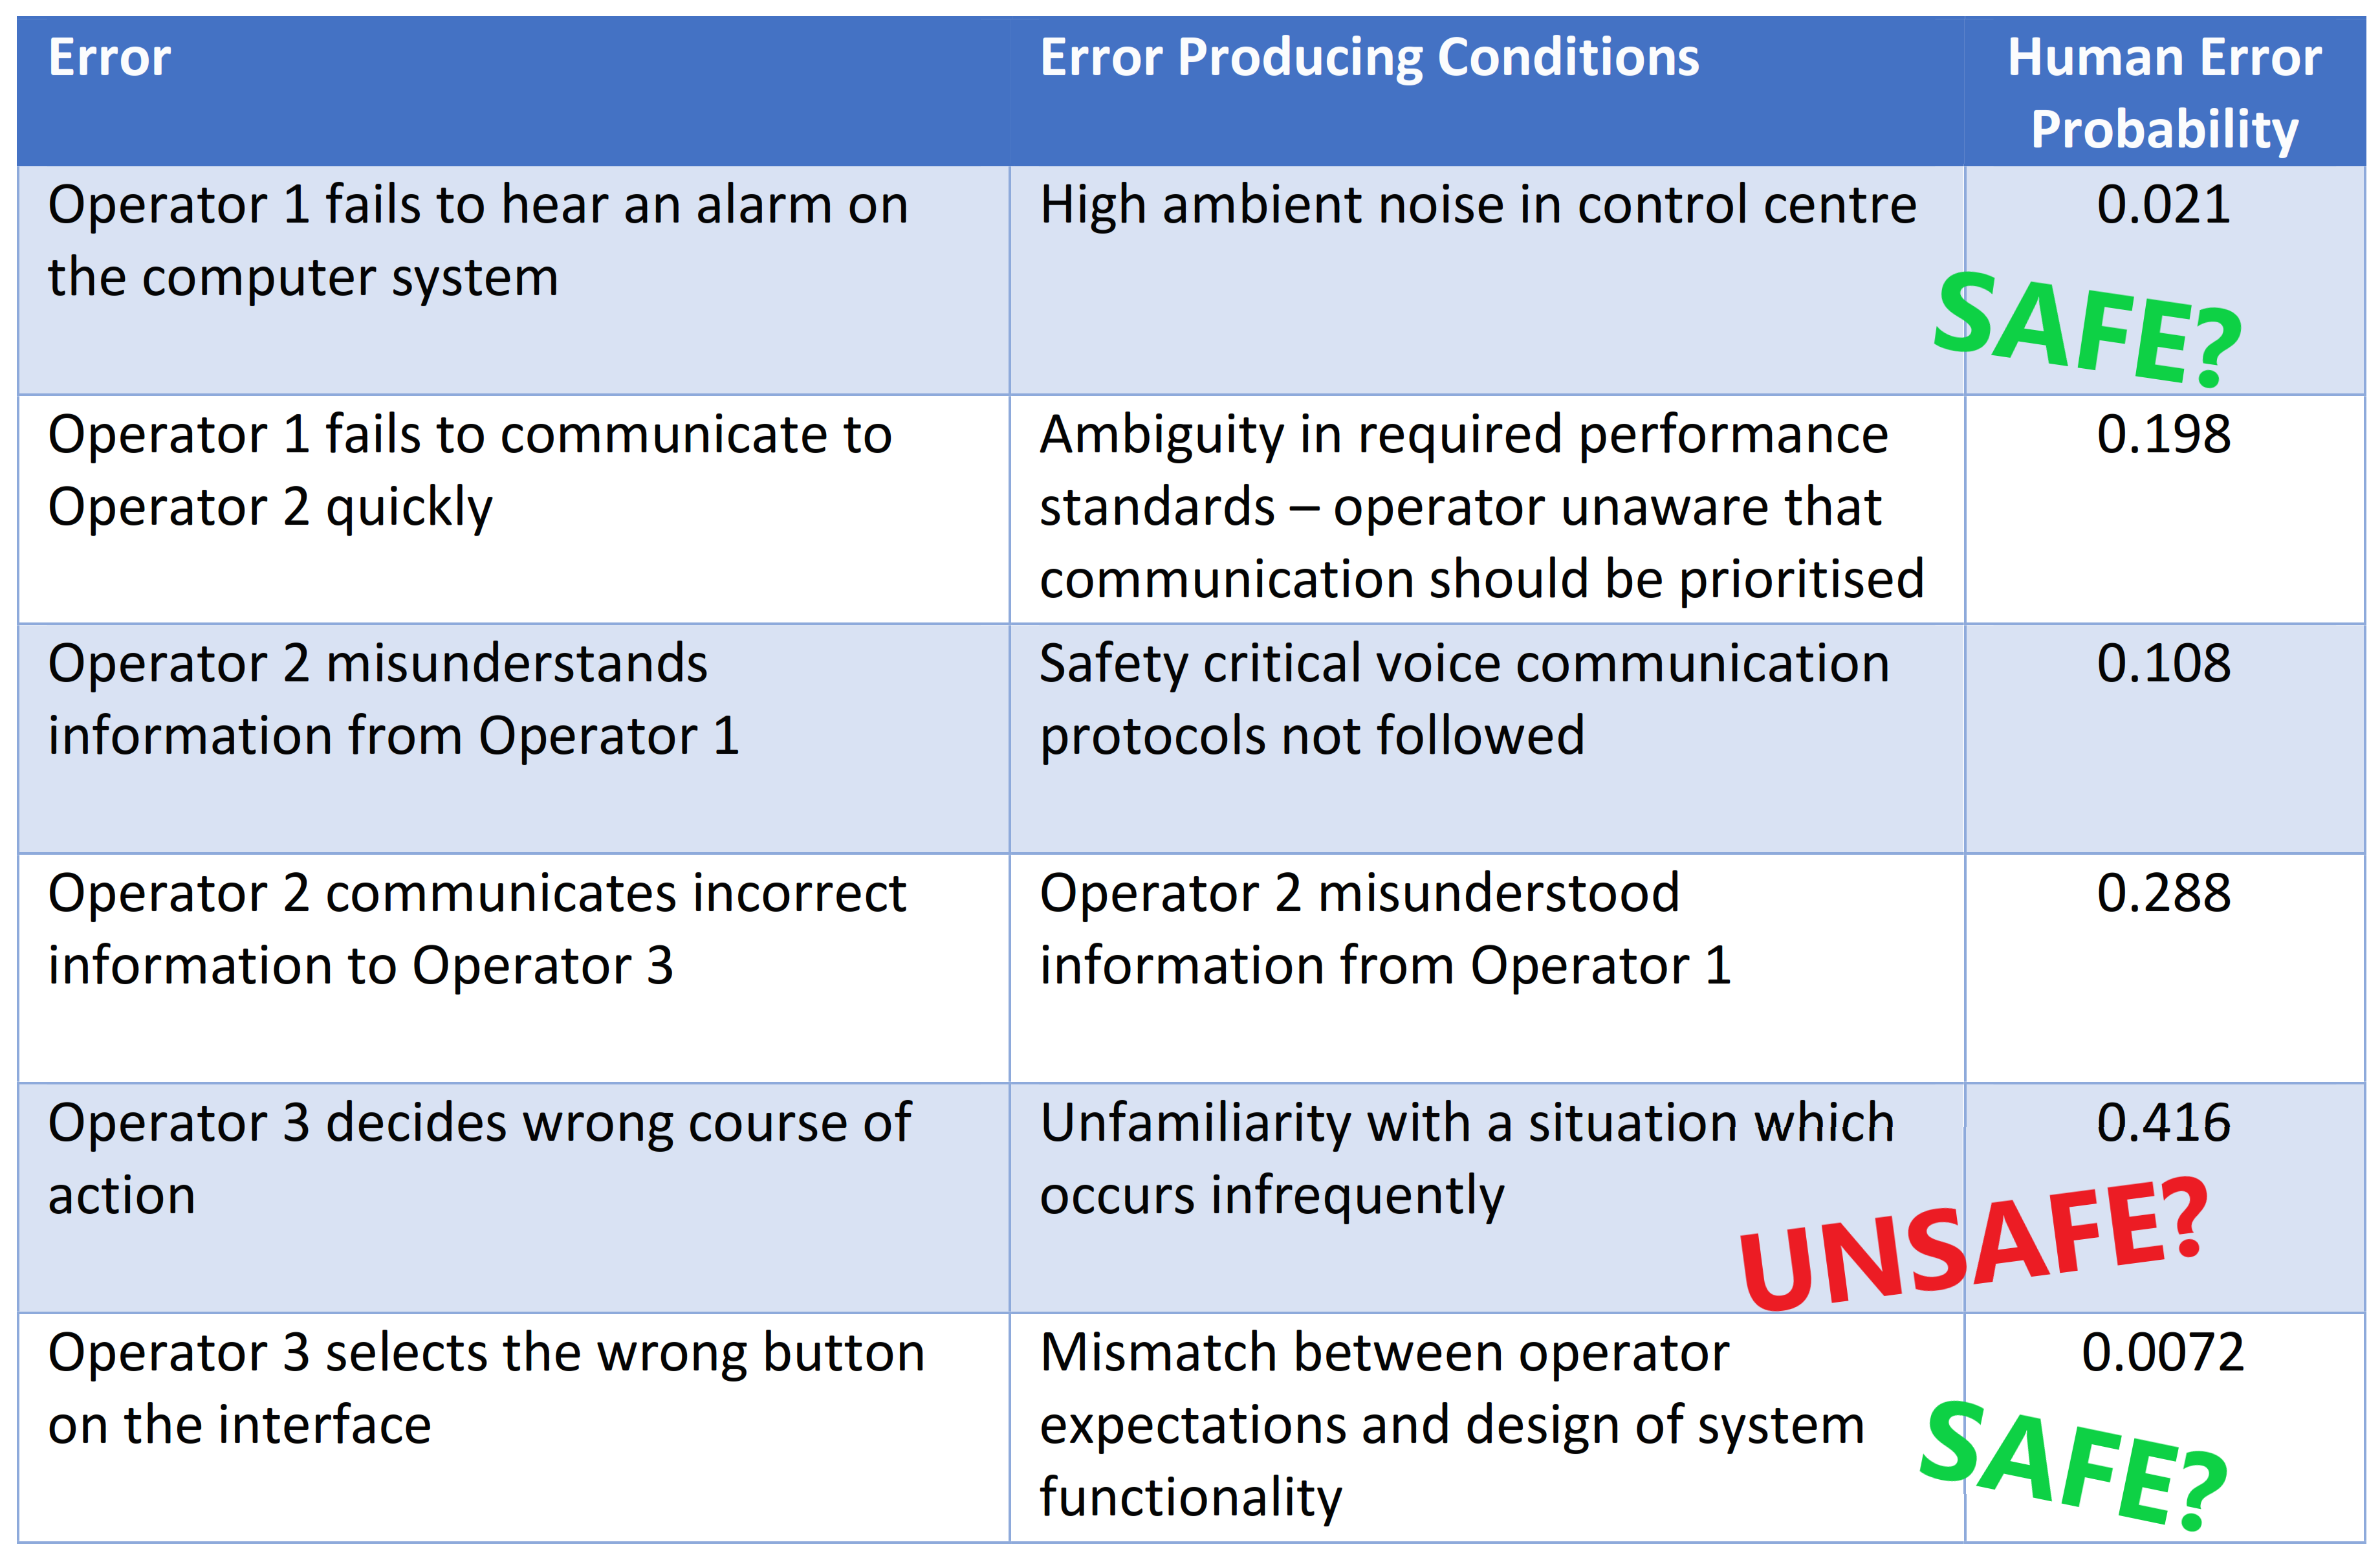
In our example, the probability of four of the potential human errors occurring is above 0.1 but this does not necessarily mean the system is unsafe. Equally, having the likelihood of all potential errors below 0.5 does not demonstrate the system is safe. Calculating the human error probability is just the starting point.
How Can Human Error Rates Be Used?
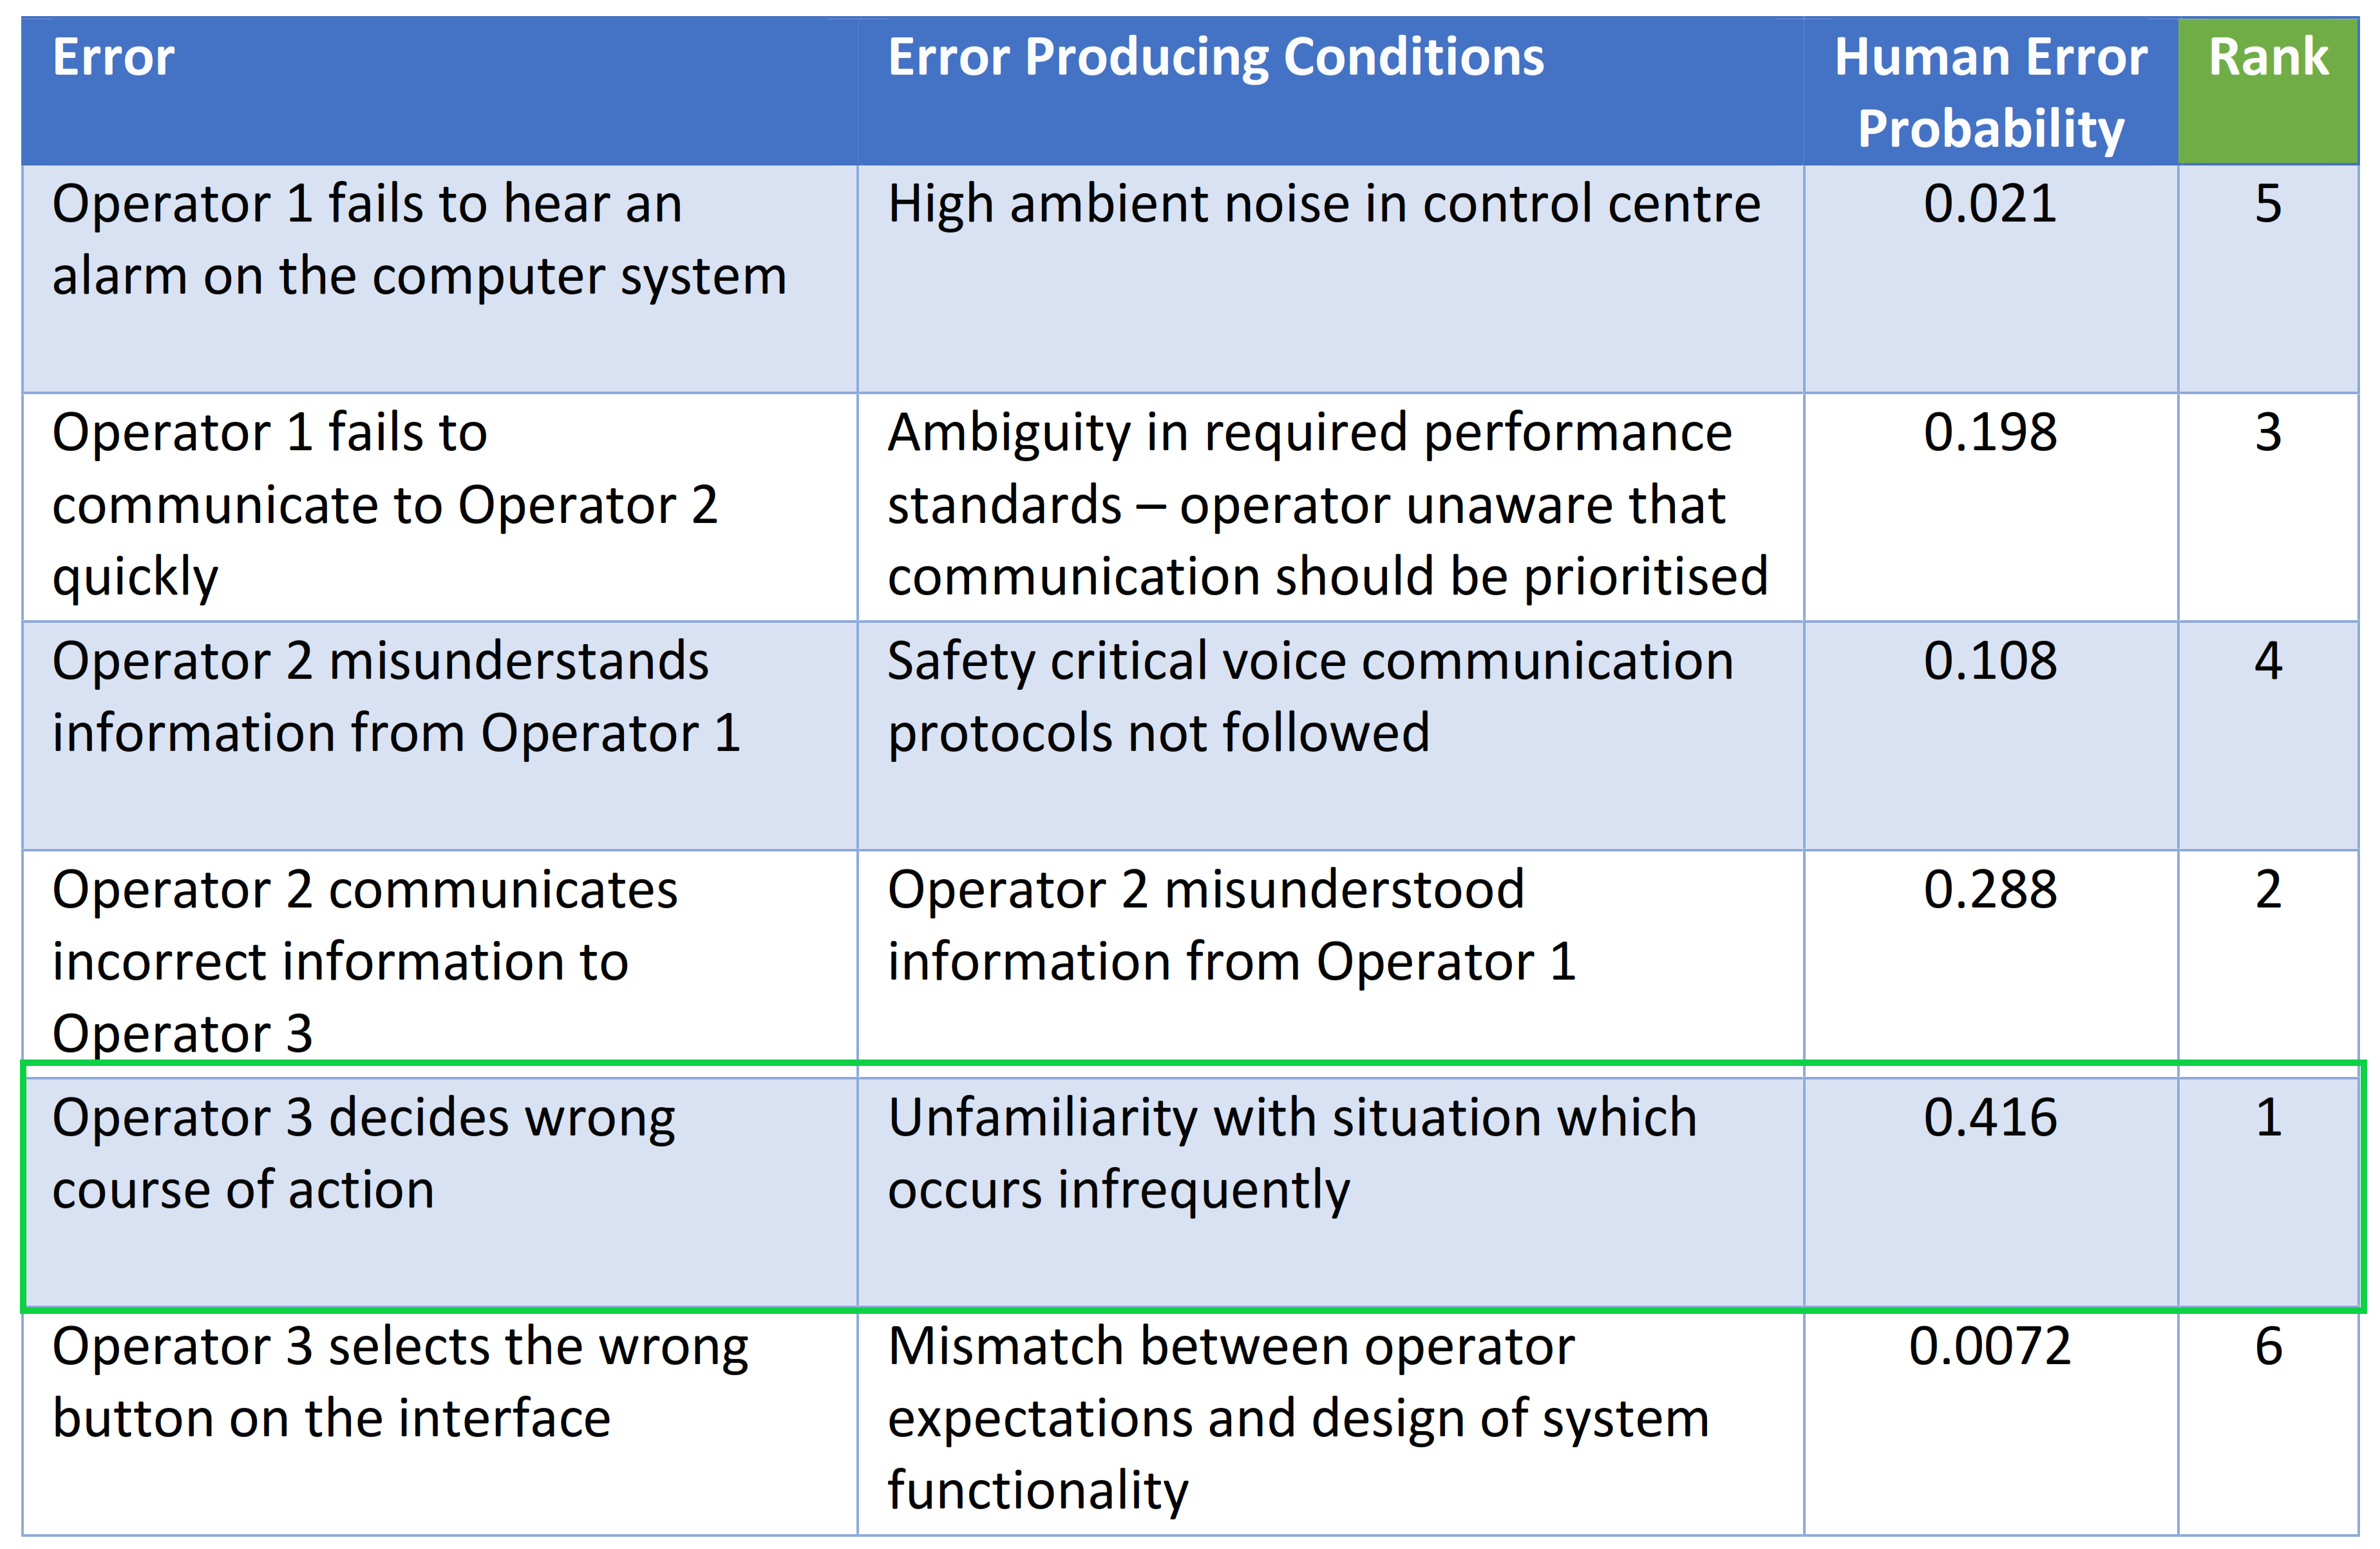
While it’s important not to focus too much on the exact number calculated during the human reliability assessment, the relative magnitude of each error rate provides a useful basis for deciding which parts of the system under design require further attention.
The human error probabilities calculated, allow for the potential errors to be ranked in order of most likely to occur to least likely to occur. This allows human factors practitioners to take a So Far As Is Reasonably Practicable (SFAIRP) approach to considering whether enough has been done to manage the risk in parts of the system that are more vulnerable to human error or contributing negatively to the safety case.
Once the potential errors have been ranked, we can identify the areas of highest risk and consider whether a particular part of the system could be redesigned to eliminate the potential for human error or reduce the likelihood of it occurring.
In some instances, redesigning a system may be considered too expensive or too difficult and non-engineering controls need to be explored. Identifying the high-risk areas also can help to focus attention on controls that may limit the impact of the consequences of an error.
Aside from being used to rank potential errors in order of importance to help focus attention, calculating human error rates can be used to support optioneering of design solutions and risk controls. It can also demonstrate the effectiveness of proposed mitigations: what happens to the number associated with a particular human error if different controls are introduced?
Using our example from before, we have ranked the potential human errors in order of most likely to occur to least likely to occur. The analysis demonstrates that there is a high reliance on chains of communication between operators, which introduces risk of communication errors including mishearing, misunderstanding or incorrectly relaying information.
The human error with the highest probability of occurring is Operator 3 deciding the wrong course of action, which may lead to the operator creating an unsafe environment. Further analysis of this potential error showed that it could result from errors made earlier in the process, including miscommunication.
Therefore, the focus of system design should be to reduce the likelihood and/or consequences of the primary and contributory errors. The project is currently considering design changes to reduce the reliance on operator communication.
This may include automatic presentation of on-screen information in place of voice communications. The Human Reliability Assessment will be revisited to determine the impact of the proposed controls and design solutions on the probability of human error.
Conclusion
A safety argument often includes a reliance on the humans operating, maintaining or using the system safely. Calculating human error probabilities helps to quantitatively demonstrate, a reduction of risk SFAIRP.
However, the focus should not be on what the exact number is. Human error rates are best used to support identification of which parts of the system may be more vulnerable to user errors. The number can also be used to plan and prioritise the human factors work to focus on the areas with the highest risk rating. Furthermore, this directs attention to the appropriate parts of the system that may warrant consideration of engineering and non-engineering solutions.
Stephanie Cynk & Keryn Pauley
Related Content: Podcast – Integrating HF & Systems Assurance into Major Projects